
Philippine Performance for the Past Five Years
| Year* | No. of Countries | Indicator | |
| Overall ranking | Overall score | ||
| 2014 | 175 | 85 | 38 |
| 2015 | 167 | 95 | 35 |
| 2016 | 176 | 101 | 35 |
| 2017 | 180 | 111 | 34 |
| 2018 | 180 | 99 | 36 |
* Aside from the overall ranking, all are reflected as scores. The closer to 100, the better.
The country climbed 12 spots (99th out of 180 countries) this year. This translates into a percentile rank of 45.0 (vs. 38.3 in 2017), surpassing the 2018 target in the 2017-2022 Philippine Development Plan (PDP) Results Matrix. In terms of score, the Philippines earned 36/100, improving its 2017 score at 34/100.
Contributory to this increase, the Office of the Ombudsman has registered accomplishments in its punitive, preventive and promotional strategies. The Office has continuously implemented its 7-Year Roadmap through the Integrity Management Program; the electronic filing of statements, assets, liabilities and net worth; and the Integrity Caravans. Further, the Office has reduced its case backlog with its docket now down to 6,000 cases by the end of 2017 (from around 20,000 in 2011).
Aside from the Office of the Ombudsman, the whole of government has been firm in its commitment to weed out corruption in the bureaucracy through the creation of the Presidential Anti-Corruption Commission, the dismissal of erring officials and streamlining of government procedures.
As recommended by the Transparency International, the Philippines is moving towards a “robust and comprehensive strategy” through full implementation of the commitments to the United Nations Convention against Corruption and the development of a new mid-term roadmap under the new Ombudsman.
Moreover, anti-corruption initiatives are expected to level up in terms of scale, technology use and citizen participation. Strategies will be expanded through collaborative efforts between government and citizens. Internally, procedures will be simplified to expedite processing and prosecution of cases. Citizens will also be enjoined to participate in anti-corruption efforts through participatory audits and engagement in governance issues.
Philippine vs. ASEAN Performance (Current vs. Past Year)
| Country* | 2018
Overall Ranking |
2018
Percentile Rank** |
2017
Percentile Rank |
Change
(2018 vs. 2017) |
| Brunei | 31 | 82.78 | 82.22 | +0.56 |
| Cambodia | 161 | 10.56 | 10.56 | 0.00 |
| Indonesia | 89 | 50.56 | 46.67 | +3.89 |
| Lao PDR | 132 | 26.67 | 25 | +1.67 |
| Malaysia | 61 | 66.11 | 65.56 | +0.56 |
| Myanmar | 132 | 26.67 | 27.78 | -1.11 |
| Philippines | 99 | 45.00 | 38.33 | +6.67 |
| Singapore | 3 | 98.33 | 96.67 | +1.67 |
| Thailand | 99 | 45.00 | 46.67 | -1.67 |
| Vietnam | 117 | 35.00 | 40.56 | -5.56 |
* 180 countries were measured.
** The closer to 100, the better the score.
The ASEAN experienced better percentile ranks compared to 2017 conditions, except for non-mover Cambodia and decliners Thailand and Vietnam. The Philippines achieved the biggest climb at +6.67 points while the biggest fall was for Vietnam at -5.56 points. This has resulted in the Philippines’ steady movement towards the upper half of the region. The country is now catching up with Indonesia (50.6 pctl); at par with Thailand (45.0 pctl); and besting Vietnam (35.0 pctl).
Indicator Overview
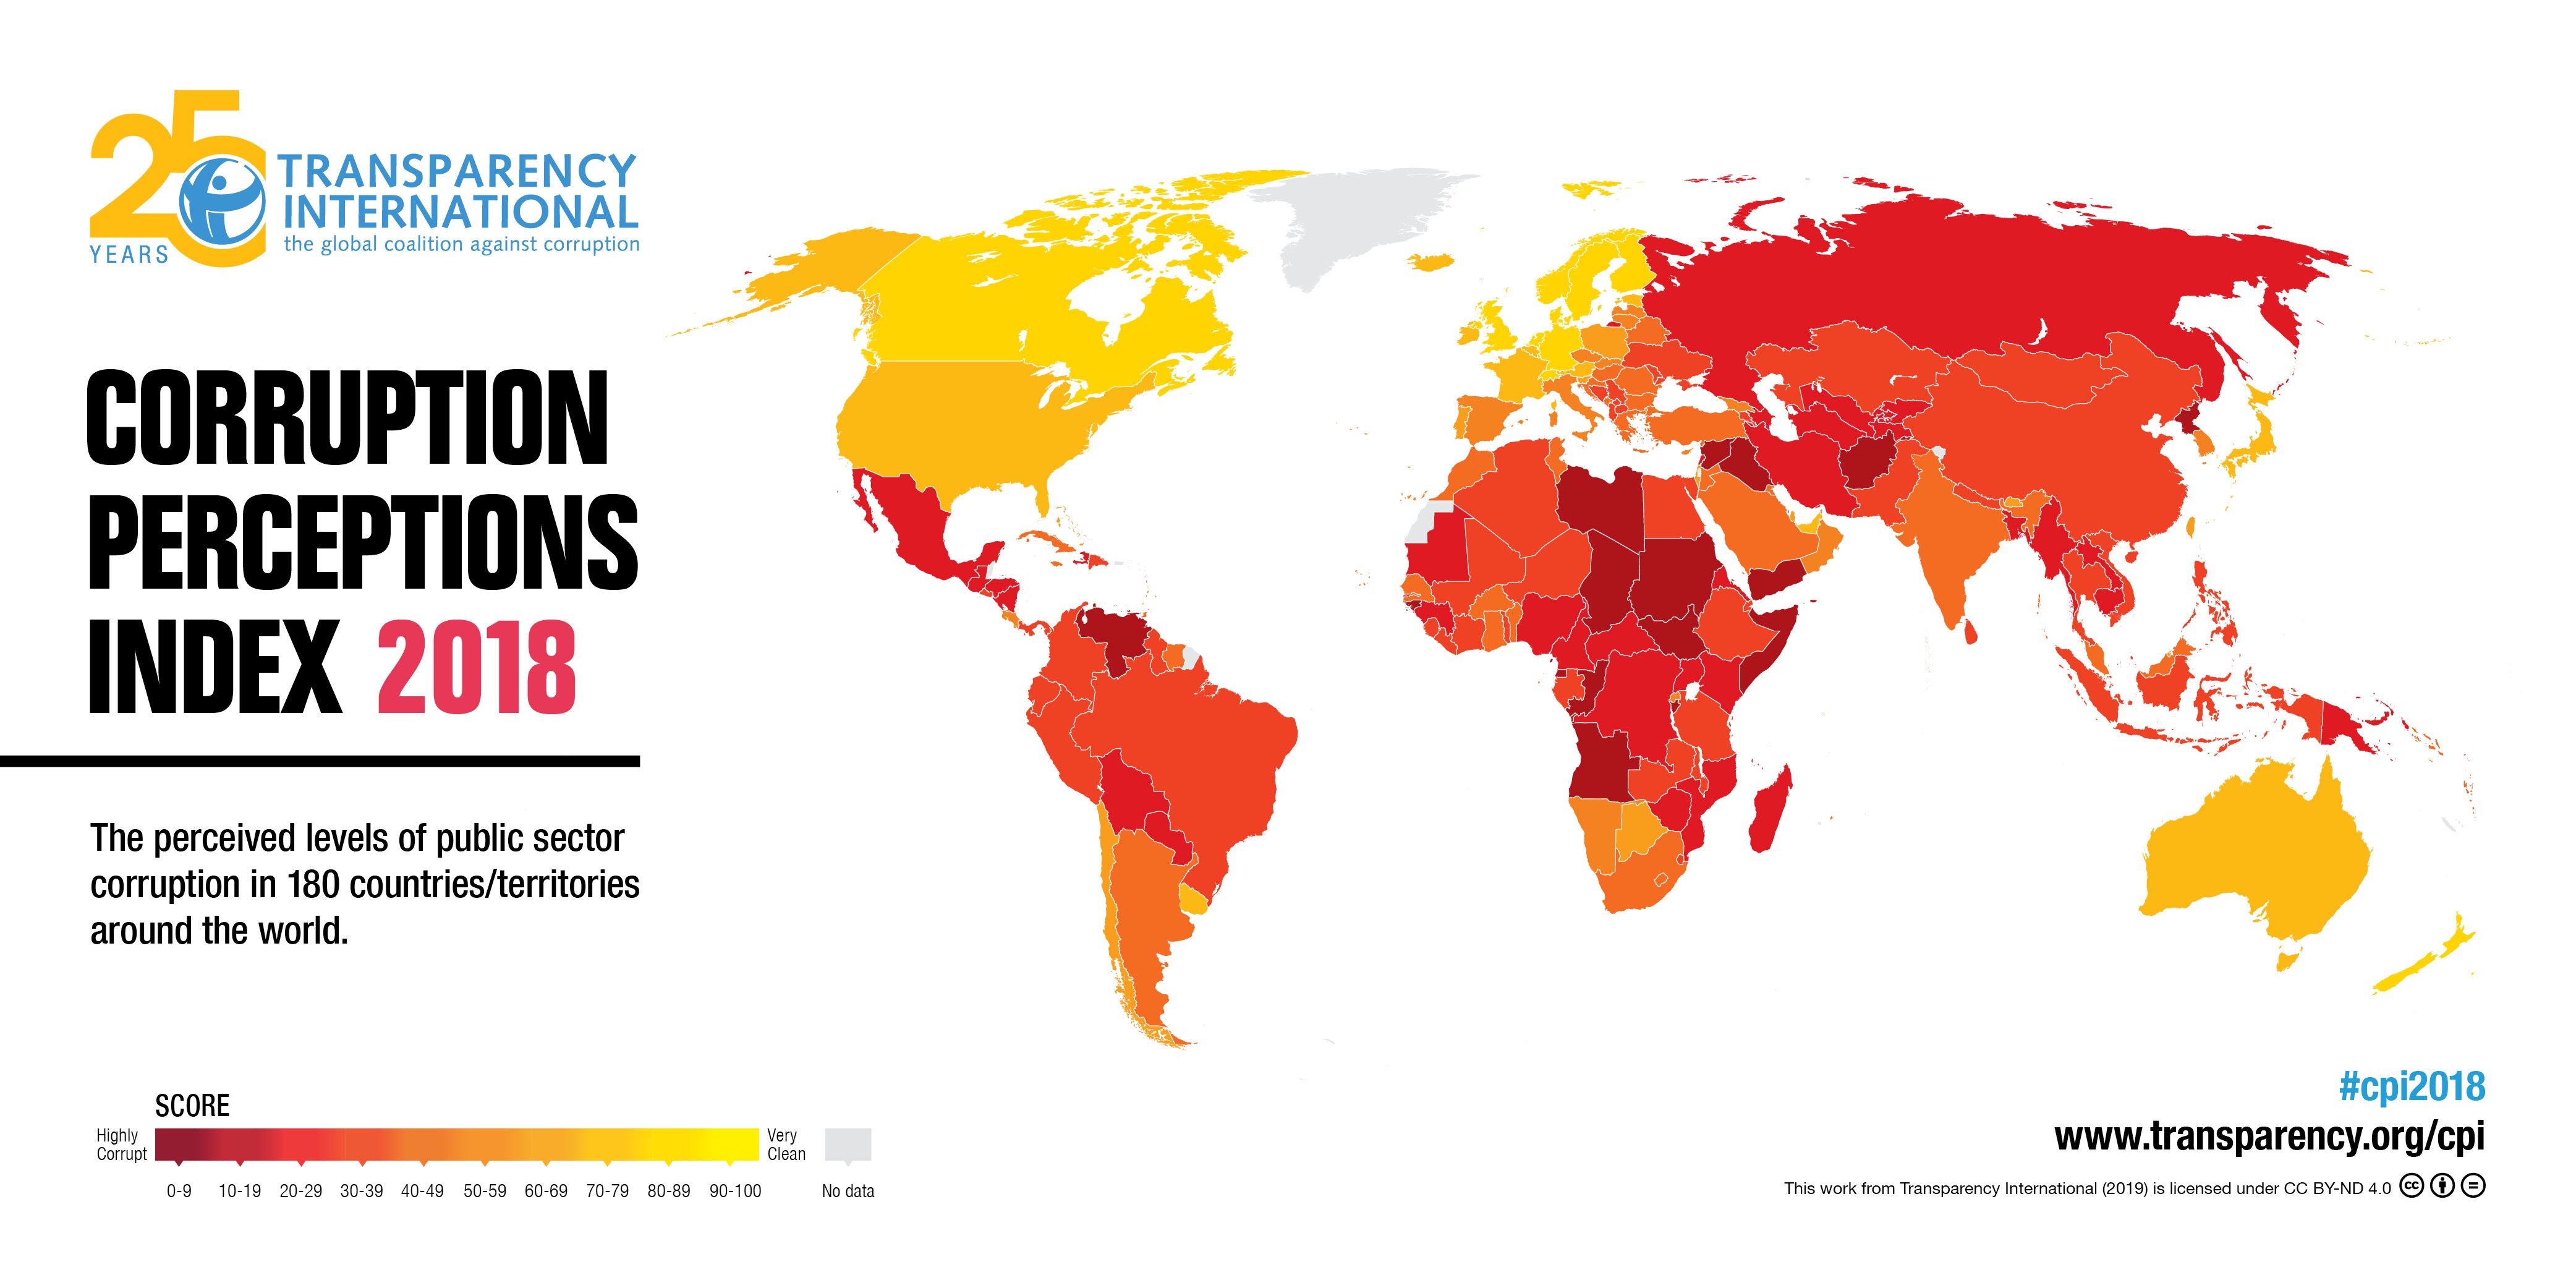
The CPI scores and ranks countries/territories based on how corrupt a country’s public sector is perceived to be by experts and business executives. It is a composite index, a combination of 13 surveys and assessments of corruption, collected by a variety of reputable institutions. The CPI is the most widely used indicator of corruption worldwide.
This indicator is committed as part of Chapter 5’s Results Matrix in determining whether corruption has been reduced.
Further Information
Frequency of update: Yearly
Publication of update: 21 February 2018
Period of study: Past 12 months
Link to the main site: https://www.transparency.org/research/cpi
Historical data: https://www.transparency.org/research/cpi/overview